loudspeakers.audio
I’m working on a very new website for online acoustics measurements. It is now in a trial (and free) phase so if anyone is interested, he may do some tests here. Feedback would be appreciated.
Just as a reminder, group-delay due to the loudspeaker in a box is limited to about 0.15 * alignement order / frequency, which is also equivalent to (0.15 * order) periods.
Ie for a standard 4th order bass-reflex with a standard B4 at 30Hz, max group-delay is about 20ms.
So if you measure group delay of 60, 70ms or more, this is due to the room modes not to the loudspeaker itself !
Considering that a group-delay of 1 period (1 cycle) is non audible in low frequencies, we can consider that both 4th or 6th orders alignement should not be audible in any case.
Some news about people using the technique of Moving Mic Measurement :
Charles Sprinkle (former Harman R&D, now at Kali Audio)
https://producelikeapro.com/blog/room-calibration-at-echo-bar-studios-the-moving-mic-method/
https://www.youtube.com/watch?v=6RiuwqzjqlQ
The same Charles Sprinkle also wrote a paper for the AES about MMM in cinemas
http://www.aes.org/e-lib/browse.cfm?elib=19477
Samsung now recommands MMM (they call it MMA) for the new generation of cinema screens
https://mountaincrest.net/dev/wp-content/uploads/2018/12/Samsung_Harman_Onyx_AudioSolution_Whitepaper.pdf
Hereunder are 9 MMM measurements of the same loudspeaker (Behringer B2030A, with both LF, HF switches at -2 and -4dB) in 9 different rooms (10 to 30 m2 surfaces) at distances between 2 and 3m. It clearly shows that :
Some new measurements to compare MMM method to anechoic measurements :
n’est pas celui que ….
Une seule étude, celle du CIRC en 2015, classe le glyphosate en “probablement cancérigène” (groupe 2A), comme la viande rouge ou les boissons chaudes. Et moins cancérigène que le jambon….
Les conclusions de dizaines, voire de centaines d’autres études sont différentes : aucune preuve de cancérogénicité pour l’homme.
Concernant les abeilles, insectes,… le glyphosate n’apparait pas non plus comme nocif.
C’est une bonne chose que les lobbys écologistes soient devenus puissants, mais ils ne devraient pas imposer des points de vue idéologiques contre les vérités scientifiques. Avec l’appui des des médias et maintenant des tribunaux…
Le vrai danger est qu’un produit inoffensif soit remplacé par des produits réellement nocifs !
On peut scinder la chaîne de reproduction sonore en deux catégories de maillons :
Au final, les mesures “physiques” sont nécessaires et suffisantes pour tous les process linéaires : amplification, numériques, stockage, etc…
Par contre pour les aspects de réduction du nombre de canaux ou de débit (prise de son, réduction de débit, reproduction enceintes+salle), les mesures sont insuffisantes et une évaluation psychoacoustique est nécessaire.
I generated the new SMPTE pink noise with the SMPTE python script at 48 and 96kHz and analyzed both files with a modified version of Trackalyzer with analysis without/ with 22.4Hz-22.4kHz filter.
The filtered rms value gives -22.1dBFSD (that is rms -19.1dBFS) with a 12.1dB crestfactor (values should be -22.0dBFSD and crestfactor between 11.5 and 12dB). Note that dBFSD are dB Full Scale Digital and rms dBFS are related to a max rms level of -3.01dBFSD (rms of fullscale sine wave).
I just discoved that MMM acronym was already used for Manual Moving Microphone in a very interesting comparison for airborne sound insulation measurements.
Conclusion : 8 This investigation suggests that the manual moving mic technique (MMM), which also involves taking the tester out of the source room, produces the most repeatable results in rooms of 30m3 or more when compared with any of the other test methods. Most notable is the improved accuracy and repeatability of this method at low frequency, where modal variations produce well-documented inaccuracies in the other, more traditional test methods.
I compared results ot this study to my own MMM theorical curves (see post below), it fits quite well.
Here is the method I use to measure loudspeakers in a room as a basis for equalization. The idea is not very new but seldom used, and here you'll get some explanations of why it works. I'm really happy with it because it is quick, efficient and reliable. I also developped a simple software (not released yet) for this method. Even your wife could use it with success….
A soft that I wrote some months ago but never published, trackalyzer is an easy tool to check main values of audio tracks, especially everything related to dynamics. This soft works only on windows and for .wav files (mono, stereo, most samplerates and bitrates) so mp3, aac, flac have to be converted before (ie with foobar). For tracks with emphasis, de-emphasis is available.
This soft is slow because it uses wavread.m (gnu-Octave). I'd be glad if somebody has some ideas to improve the speed (see trackalyzer.m).
Download is here.
The result is a picture with various graphs, explained here :
Ici un petit texte illustré pour expliquer pourquoi les mesures acoustiques en un point ne sont pas valides et pourquoi il est bien plus précis d’utiliser une moyenne de mesures : mono et multi-points. Ce lien est n’est plus valide et à été remplacé par MMM.
Ce papier explique plus en détail un sujet précédent, Room EQ : 1/3rd octave EQ at one position ?
You all know David Griesinger, and his website. He introduced a new measuring method called LOC that compares direct sound energy to the buildup energy of reflections and reverberation as a new estimation of clarity. DG gives his Matlab code, so I was able to translate it into Octave and then into POPS. But how does LOC relate to phantom position ? Well, POPS should estimate the frequency dependant position and LOC could give a kind of uncertainty over it : the higher the value of LOC, the more precise the position is defined. In the setup page, you can choose to calculate LOC on binaural responses (Griesinger's original way) or on monaural IR. I have to do more tests but I thought that adding this function could be a way to check David's ideas for some rooms.
There are some questions when aligning screening rooms speakers to SMPTE levels, one is concerning the signal to use.
The latest Dolby technical guidelines for Atmos says :
Each speaker and speaker array shall be calibrated to deliver a sound pressure level (SPL) at 85dB(c) at the reference listening position from a wideband pink noise sourcesignal at -20dBFS RMS (relative to the RMS level of a 100% modulation sine wave).
Does this mean that the pink noise RMS should be at -20dBFS or at 20dB under the RMS level of a 100% modulated sine wave (-3dBFS RMS) so -3-20 = -23dBFS RMS ?
When you begin to measure a pink noise level, you end measuring also its frequency response…
Position Of Phantom Source
Summing localisation of stereophonic phantom sources depends mainly on interaural differences : level (ILD) and time (ITD).
POPS uses L and R speakers impulse responses to estimate position of frequency dependant phantom image.
Here is an exemple of the mic pushed to the right with speakers 1)directed to front and 2) toe-in (crossed in front)
Interesting to see that the phantom image is much more centered with toe-in speakers.
Old methods : to EQ at a fixed position is tricky.
Here are 18 measurements at mixer position in a screening room. All measurements are within 10cm from central position !
See all the differences, what position would you equalise ?
I added new filters to Xoralizer and (hope so) simplified the interface : it is XOralizer2, a unique tool for crossover auralization.
you can now listen to substractive delay crossovers (see Lipshitz and Vanderkooy, in AES or Kreskovsky )
Just compare complementary filters to subtractive ones when you move from sitting to standing ! For DIYers, it’s the only way to choose yours filters knowing how those will really sound like !
Another new feature : one click to record impulse response for analysis in external software.
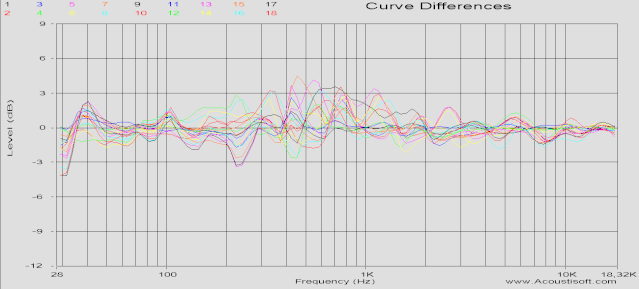
Schroeder wrote an article in JAES 1987, Statistical Parameters of the Frequency Response Curves of Large Rooms, showing that above critical frequency, the response at a given frequency lays in a gaussian strip of +-5.5dB. So you should consider the measured amplitude of a loudspeaker in a room at one point as the summation of the direct sound and the diffuse field which is a random value depending on many factors, humidity, pressure, etc… To get rid of this random part, you can average with multiple measurements, but staying near axis of the loudspeaker.
Say you do n measurements at different places, the standard deviation will then be 5.5dB/squareroot(n).
But normally, if you measure before you EQ, you would apply a smoothing, ie at 1/6th of an octave. This will reduce the standard deviation to about 2.5dB.
So to get less than 0.25dB of mean square error (the minimal audible deviation), you need about 100 measurements ! Typically with 32 measurements (ie with Acoustisoft R+D), you would get a mean square error better than 0.5dB. Note that your measurements should be uncorrelated down to the transition frequency, it means that measurement positions must be separated by about a tenth of room length.
Another calculation similar to Schroeder’s : http://www.gedlee.com/Audio_trans.htm
Pour simplifier la mesure et l’égalisation des enceintes acoustique, je propose Align2. Quelles différences avec Align ?
Align : écrit en VST, visualisation de la courbe en temps réel, pas d’analyse graphique directe des mesures
Align2 : logiciel autonome, sans visualisation directe mais analyse très complète des mesures avec graphiques, nécessite l’installation de Octave
On peut évidemment mesurer avec Align puis analyser les mesures avec Align2.
Grâce surtout aux fonctions d”analyse graphique, je conseille plutôt l’utilisation de Align2. Téléchargement (attention, versions fréquemment mises à jour en ce moment !)